PRINSEQ. PReprocessing and INformation of SEQuence data.
Manual
Web versionNecessary resources
Upload data
Standalone lite version
Necessary resources
Available options
Examples
Graphs version
Necessary resources
Available options
Quality control
Length of sequences
Base qualities
GC content
Poly-A/T tails
Ambiguous bases
Sequence duplications
Sequence complexity
Tag sequences
Contamination
Assembly
References
Data preprocessing
Manage options
Filter options
Trim options
Reformat options
References

Preprocessing 454 data
01/16/2011
PDF, 92 KB

Preprocessing FASTA-only data
01/16/2011
PDF, 76 KB

Raw data processing
01/16/2011
PDF, 112 KB

Quality control
01/16/2011
PDF, 520 KB

Data preprocessing
09/01/2011
PDF, 827 KB
Introduction
PRINSEQ is a tool that generates summary statistics of sequence and quality data and that is used to filter, reformat and trim next-generation sequence data. It is particular designed for 454/Roche data, but can also be used for other types of sequence data. PRINSEQ is available through a user-friendly web interface or as standalone version. The standalone version is primarily designed for data preprocessing and does not generate summary statistics in graphical form.
PRINSEQ is distributed under the GNU Public License (GPL). All its source codes are freely available to both academic and commercial users. The latest version can be downloaded at the SourceForge download page.
Web version
TOP OF PAGEThe interactive web interface provides summary statistics for quality control that can help to choose parameters for data preprocessing. PRINSEQ provides filter, trim and reformat options for data preprocessing.
Necessary resources
Hardware
- Computer connected to the Internet
Software
- Up-to-date Web browser (Firefox, Safari, Chrome, Internet Explorer, ...)
Files
- FASTA file with sequence data
- QUAL file with quality scores (if available)
- FASTQ file (as alternative format)
Upload data to the PRINSEQ web version
To upload a new dataset in FASTA and QUAL format (or FASTQ format) to PRINSEQ, follow these steps:
1. Go to http://prinseq.sourceforge.net
2. Click
on "Use PRINSEQ" in the top menu on the right (the latest PRINSEQ web version should load)
3. Click on "Upload new data"
4. Select your FASTA and QUAL files or your FASTQ file and click "Submit"
After the data is parsed and processed successfully, the user interface will show a menu on the left and a message in the main panel as shown below.

Notes
After clicking the submit button, a status bar (not progress bar) will be displayed until the file upload is completed. During the data processing, several progress bars will show the progress of the data parsing and statistics calculation steps. After the data is parsed and processed successfully, the user interface will provide a menu on the left and information and guidance in the main panel.
Possible problems
1. The PRINSEQ web interface does not load / is not visible.
You only see this and nothing else happens:

Solution: Make sure that you have JavaScript activated in your browser, as this is required to load and use PRINSEQ's web interface.
2. The upload status bar does not disappear.
After clicking on the submit button you see this and it does not disappear:

Solution: The first thing to check is if the file is still uploading. The easiest way to do this is by checking the loading icon in your browser.

If you see the loading icon (right) instead of the PRINSEQ icon (left), your file is still uploading and you should give it more time. If you see the PRINSEQ icon instead of the loading icon, your file did not upload completely and this caused an error. If you have a slow connection to the Internet or try to upload large files, the connection to the web server can time out before the upload was completed. If you did not upload compressed files, try to compress your files with any of the supported compression algorithms (ZIP, GZIP, ...).
In rare cases, the issue can also be caused by certain Firefox plugins or extensions. If possible, use an alternative browser to test if this was the case. If the browser caused the problem, updating Firefox and the plugins/extension to the latest version might solve the problem.
Quality control
TOP OF PAGESequencing technologies are not perfect and the quality control (QC) is an essential step to ensure that the data used for downstream analysis is not compromised of low-quality sequences, sequence artifacts, or sequence contamination that might lead to erroneous conclusions. The easiest way of QC is looking at summary statistics of the data. There are different programs that can produce those statistics. Web applications allow users to easily share and discuss the results with other people without transferring large data files. The following QC steps are implemented in and all graphics generated by PRINSEQ.
Number and length of sequences
Check those numbers to make sure it matches approximately the manufacturer estimates. If your numbers are off too much, check the raw data and filter statistics in "454BaseCallerMetrics" and "454QualityFilterMetrics".
Length distribution
The length distribution can be used as quality measure for the sequencing run. You would expect a normal distribution for the best result. However, most sequencing results show a slowly increasing and then a steep falling distribution. The plots in PRINSEQ mark the mean length (M) and the length for one and two standard deviations (1SD and 2SD), which can help to decide where to set length thresholds for the data preprocessing. If any of the sequences is longer than 100 bp, the lengths will be binned in the plots generated by PRINSEQ. The number of sequences for each bin is then shown instead of the number of sequences for a single length (values might therefore be bigger than shown in the table for non-binned lengths).
The following two datasets have approximately the same number of sequences, however the length distributions look different.


Both distributions have the highest number of sequences around 500 bp, but for the first dataset the mean of the sequence lengths is higher and the standard deviation is lower. A certain number of shorter reads might be expected, but if the sample contained mainly longer fragments, this number should be low.
Assuming that both samples contained enough fragments of at least 500 bp and all fragments were sequenced with the same number of cycles (sequencing flows), we would expect that the majority of the sequences would have approximately the same length. The higher amount of shorter reads in the second dataset suggests that those reads might have been of lower quality and were trimmed during the signal processing. If the sample contained many short fragments, the shorter reads might be from those fragments and not of lower quality.
Minimum and maximum read length
Sequences in the SFF files can be as short as 40 bp (shorter sequences are filtered during signal processing). For multiplexed samples, the MID trimmed sequences can be as short at 28 bp (assuming a 12 bp MID tag). Such short sequences can cause problems during, for example, database searches to find similar sequences. Short sequences are more likely to match at a random position by chance than longer sequences and may therefore result in false positive functional or taxonomical assignments. Furthermore, short sequences are likely to be quality trimmed during the signal-processing step and of lower quality with possible sequencing errors.
In some cases, sequences can be much longer than several standard deviations above the mean length (e.g. 1,500+ bp for a 500 bp mean length with a 100 bp standard deviation). Those sequences should be used with caution as they likely contain long stretches of homopolymer runs as in the following example below. Homopolymers are a known issue of pyrosequencing technologies such as 454/Roche [1].
aactttaaccttttaaaacccccttaaaaaaactttaaaccccgtaaaccccccgggttt
ttttttaaaaaaccgttttttacgggggtttaccccgttttaccggggttttgggggttt
taaaaaaaacgggttttaaacgggttaacccccgggttttccgggggtttaaaaagtttt
tttaaacgggggttttcccgtaaaaaaaaaaccccgtttaaaaaaaggggttaaaaaaaa
aaggggttaaccccccggggtttaaaaaaaaccttttttttttttaaaaaaaacgttttt
tttttttaaaaggggttttttttacgggggtaaacgggggggttaaaaaaaaaccccccc
cggggggttttaaaaaaaaaacccccggttttaaaaaaccccgttttaacccctttaaaa
aaaaaacgggggggttttaaaaaaaaaagggggttttttttttttaaaaacccgttttta
aaaaccccccgttttttaacccgggttaaaccccccccgggggggtaaaacccccccccc
ggggtaaccccctttttttaaaacccccccccgttttttacccgggggtttttacccccg
gggggggtaaaaaaacggggggtttttttttttttaaaaccggggttttttttttttaaa
ccccggtttttaaaaaccggtttttaccccggggggttttacccccgggggggggttttt
aaaacccccggtttaaaactttaaaaacccgggtaaccccggggttttaaaaaaaaaaaa
aaaaccccccccgttaaaaaaaaaaaacccgttttttttttaaaaaaaacccccccccgg
ttttaaaaccccccccgggggtttttaccccggggttttaaaaaaaacccgtttaaaaaa
accgggttttttaaaggggttttaaacccccccccc
Base qualities
As for Sanger sequencing, next-generation sequencers produce data with linearly degrading quality across the read. The quality scores for 454/Roche sequencers are Phred-based since version 1.1.03, ranging from 0 to 40. Phred values are log-scaled, where a quality score of 10 represents a 1 in 10 chance of an incorrect base call and a quality score of 20 represents a 1 in 100 chance of an incorrect base call.
In PRINSEQ, the quality scores are plotted across the reads using box plots. The x-axis indicates the absolute position if all reads are no longer than 100 bp and the relative position (in % of read length) if any read is longer than 100 bp. For datasets with any read longer than 100 bp, a second plot shows binned quality values to keep its absolute positions. This plot is helpful to identify quality scores at the end of longer reads, which would otherwise be grouped with the ends of the shorter reads. The following example shows the quality scores across the read length for fragments sequenced with GS FLX using the Titanium kit. The sequences with low quality scores at the ends should be trimmed during data preprocessing.
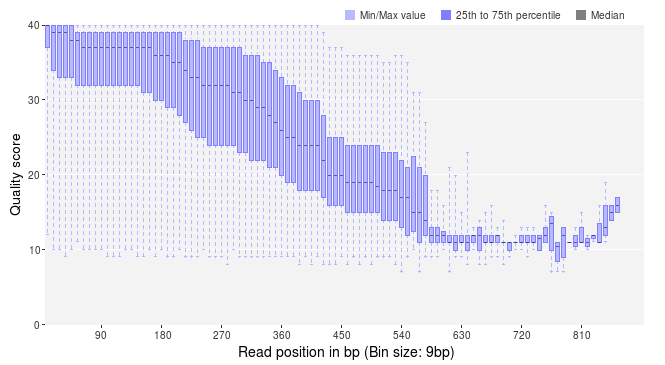
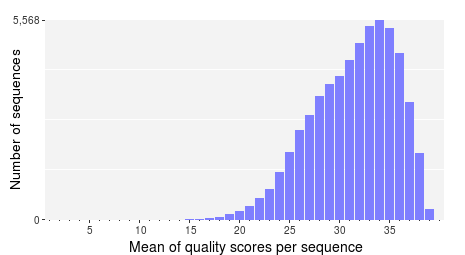
In addition to the decrease in quality across the read, regions with homopolymer stretches will tend to have lower quality scores. Huse et al. [1] found that sequences with an average score below 25 had more errors than those with higher averages. Therefore, it is helpful to take a look at the average (or mean) quality scores. PRINSEQ provides a plot that shows the distribution of sequence mean quality scores of a dataset, as shown below. The majority of the sequences should have high mean quality scores.
Low quality sequences can cause problems during downstream analysis. Most assemblers or aligners do not take into account quality scores when processing the data. The errors in the reads can complicate the assembly process and might cause misassemblies or make an assembly impossible.
GC content
The GC content distribution of most samples should follow a normal distribution. In some cases, a bi-modal distribution can be observed, especially for metagenomic data sets. The GC content plot in PRINSEQ marks the mean GC content (M) and the GC content for one and two standard deviations (1SD and 2SD). This can help to decide where to set the GC content thresholds, if a GC content filter will be applied. The plot can also be used to find the thresholds or range to select sequences from a bi-modal distribution.
Poly-A/T tails
Poly-A/T tails are considered repeats of As or Ts at the sequence ends. In PRINSEQ, the minimum length of a tail is 5 bp and sequences that contain only As or Ts are counted for both ends. A small number of tails can occur even after trimming poly-A/T tails. For example, a sequence that ends with AAAAATTTTT and that has been trimmed for the poly-T will still contain the poly-A.
Trimming poly-A/T tails can reduce the number of false positives during database searches, as long tails tend to align well to sequences with low complexity or sequences with tails (e.g. viral sequences) in the database.
Ambiguous bases
Sequences can contain the ambiguous base N for positions that could not be identified as a particular base. A high number of Ns can be a sign for a low quality sequence or even dataset. If no quality scores are available, the sequence quality can be inferred from the percent of Ns found in a sequence or dataset. Huse et al. [1] found that the presence of any ambiguous base calls was a sign for overall poor sequence quality.
Ambiguous bases can cause problems during downstream analysis. Assemblers such as Velvet and aligners such as SHAHA2 or BWA use a 2-bit encoding system to represent nucleotides, as it offers a space efficient way to store sequences. For example, the nucleotides A, C, G and T might be 2-bit encoded as 00, 01, 10 and 11. The 2-bit encoding, however, only allows to store the four nucleotides and any additional ambiguous base cannot be represented. The different programs deal with the problem in different ways. Some programs replace ambiguous bases with a random base (e.g. BWA [2]) and others with a fixed base (e.g. SHAHA2 and Velvet replace Ns with As [3]). This can result in misassemblies or false mapping of sequences to a reference sequence and therefore, sequences with a high number of Ns should be removed before downstream analysis.
Sequence duplications
Real or artificial? Assuming a random sampling of the genomic material in an environment such as in metagenomic studies, reads should not start at the same position and have the same errors (at least not in the numbers that they have been observed in most metagenomes). Gomez-Alvarez et al. [5] investigated the problem in more detail and did not find a specific pattern or location on the sequencing plate that could explain the duplications.
Duplicates can arise when there are too few fragments present at any stage prior to sequencing, especially during any PCR step. Furthermore, the theoretical idea of one micro-reactor containing one bead for 454/Roche sequencing does not always translate into practice where many beads can be found in a single micro-reactor. Unfortunately, artificial duplicates are difficult to distinguish from exactly overlapping reads that naturally occur within deep sequence samples.
The number of expected sequence duplicates highly depends on the depth of the library, the type of library being sequenced (whole genome, transcriptome, 16S, metagenome, ...), and the sequencing technology used. The sequence duplicates can be defined using different methods. Exact duplicates are identical sequence copies, whereas 5' or 3' duplicates are sequences that are identical with the 5' or 3' end of a longer sequence. Considering the double-stranded nature of DNA, duplicates could also be considered sequences that are identical with the reverse complement of another sequence.
The different plots in PRINSEQ can be helpful to investigate the degree of sequence duplications in a dataset. The following plot shows the number of sequence duplicates for different lengths. The distribution of duplicates should be similar to the length distribution of the dataset. The number of 5' duplicates is higher for shorter sequences (as observed in the example below), suggesting that exact sequence duplicates may have been trimmed during signal processing.
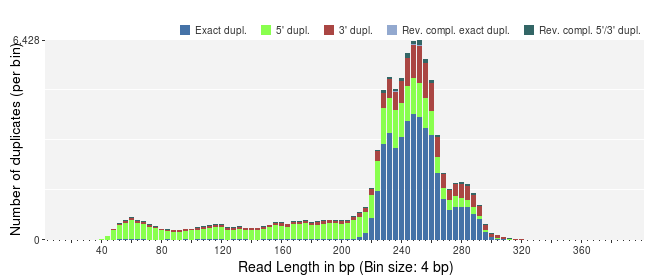

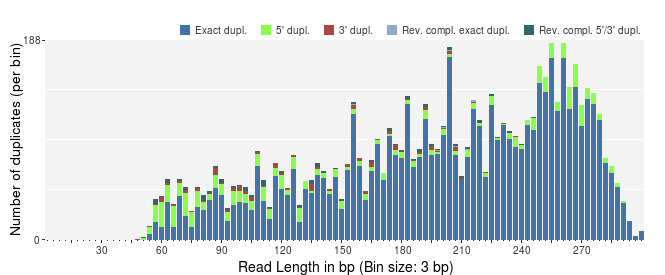
The number of exact duplicates is often higher than the number of 5' and 3' duplicates as in the following example.
PRINSEQ offers additional plots to investigate the sequence duplicates from different points of view. The plot showing the sequence duplication levels (with number of sequences with one duplicate, two duplicates, three duplicates, ...) can be used to identify the distribution of duplicates (e.g. do many sequences have only a few duplicates). The plot showing the highest number of duplicates for a single sequence (top 100) can help to indentify if only a few sequences have many duplicates (e.g. as a result of specific PCR amplification) and what the highest duplication numbers are.
Depending on the dataset and downstream analysis, it should be considered to filter sequence duplicates. The main purpose of removing duplicates is to mitigate the effects of PCR amplification bias introduced during library construction. In addition, removing duplicates can result in computational benefits by reducing the number of sequences that need to be processed and by lowering the memory requirements. Sequence duplicates can also impact abundance or expression measures and can result in false variant (SNP) calling. The example below shows the alignment of sequences against a reference sequence (gray). The sequence duplicates (starting at the same position) suggest a possibly false frequency of base C at the position marked in bold.

Keep in mind that the number of sequence duplicates also depends on the experiment. For short-read datasets with high coverage such as in ultra-deep sequencing or genome re-sequencing datasets, eliminating singletons can present an easy way of dramatically reducing the number of error-prone reads.
Sequence complexity
Genome sequences can exhibit intervals with low-complexity, which may be part of the sequence dataset when using random sampling techniques. Low-complexity sequences are defined as having commonly found stretches of nucleotides with limited information content (e.g. the dinucleotide repeat CACACACACA). Such sequences can produce a large number of high-scoring but biologically insignificant results in database searches. The complexity of a sequence can be estimated using many different approaches. PRINSEQ calculates the sequence complexity using the DUST and Entropy approaches as they present two commonly used examples.
The DUST approach is adapted from the algorithm used to mask low-complexity regions during BLAST search preprocessing [6]. The scores are computed based on how often different trinucleotides occur and are scaled from 0 to 100. Higher scores imply lower complexity and complexity scores above 7 can be considered low-complexity. A sequence of homopolymer repeats (e.g. TTTTTTTTT) has a score of 100, of dinucleotide repeats (e.g. TATATATATA) has a score around 49, and of trinucleotide repeats (e.g. TAGTAGTAGTAG) has a score around 32.
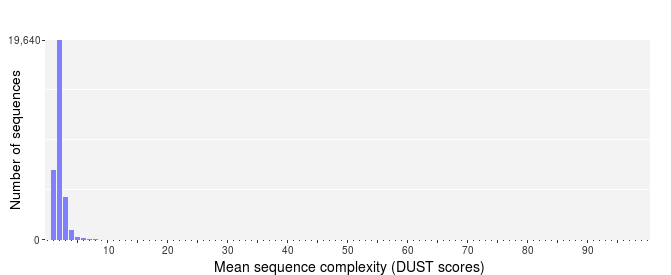
The Entropy approach evaluates the entropy of trinucleotides in a sequence. The entropy values are scaled from 0 to 100 and lower entropy values imply lower complexity. A sequence of homopolymer repeats (e.g. TTTTTTTTT) has an entropy value of 0, of dinucleotide repeats (e.g. TATATATATA) has a value around 16, and of trinucleotide repeats (e.g. TAGTAGTAGTAG) has a value around 26. Sequences with an entropy value below 70 can be considered low-complexity.

Tag sequences
Tag sequences are artifacts at the ends of sequence reads such as multiplex identifiers, adapters, and primer sequences that were introduced during pre-amplification with primer-based methods. The base frequencies across the reads present an easy way to check for tag sequences. If the distribution seems uneven (high frequencies for certain bases over several positions), it could indicate some residual tag sequences. The following three examples show the base frequencies of datasets with no tag sequence, multiplex identifier (MID) tag sequence, and whole transcriptome amplified (WTA) tag sequence.


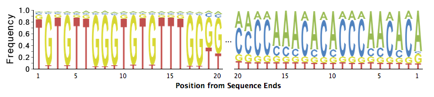
Those tag sequence should be trimmed using a program such as TagCleaner (http://tagcleaner.sourceforge.net) [4]. The input to any such trimming program should be untrimmed reads (e.g. not quality trimmed), as this will allow easier and more accurate identification of tag sequences. PRINSEQ can be used after tag sequence trimming to check if the tags were removed sufficiently.
In addition to the frequency plots, PRINSEQ estimates if the dataset contains tag sequences. The probabilities for a tag sequence at the 5'- or 3'-end require a certain number of sequences (10,000 should be sufficient). A percentage below 40% does not always suggest a tag sequence, especially if it cannot be observed from the base frequencies. The estimation does not work for sequence datasets that target a single loci (e.g. 16S) and should only be used for randomly sequenced samples such as metagenomes.
Sequence contamination
Sequences obtained from impure nucleic acid preparations may contain DNA from sources other than the sample. Those sequence contaminations are a serious concern to the quality of the data used for downstream analysis, possibly causing erroneous conclusions. The dinucleotide odds ratios as calculated by PRINSEQ use the information content in the sequences of a dataset and can be used to identify possibly contamination [7]. Furthermore, dinucleotide abundances have been shown to capture the majority of variation in genome signatures and can be used to compare a metagenome to other microbial or viral metagenomes. PRINSEQ uses principal component analysis (PCA) to group metagenomes from similar environments based on dinucleotide abundances. This can help to investigate if the correct sample was sequenced, as viral and microbial metagenomes show distinct patterns. As samples might be processed using different protocols or sequenced using different techniques, this feature should be used with caution.
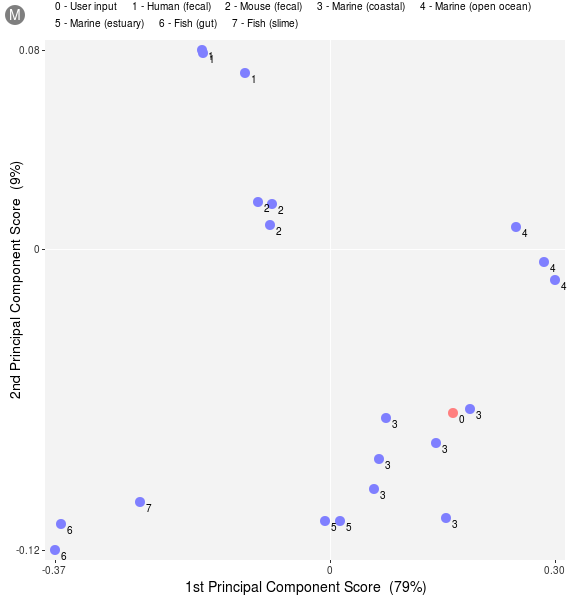
The PCA plots in PRINSEQ show how the user metagenome (represented by a red dot) groups with other metagenomes (blue dots). Since the plots are generated for microbial and viral metagenomes separately, they are marked with an M or V (top left corner). The percentages in parenthesis show the explained variation in the first and second principal component. The plots are generated using preprocessed data from published metagenomes that were sequenced using the 454/Roche sequencing platform. If sequences contain tag sequences or are targeted to a certain loci (e.g. 16S), this approach will not be able to group the user data to metagenomes from the same environment. The plot above shows how a microbial metagenome might be related to other microbial metagenomes. (This plot suggest that the metagenome is likely a marine metagenome sampled in a coastal region.)
The following plots show how a viral metagenome does not group with the microbial metagenomes (left) but closely with other mosquito metagenomes (right).

PRINSEQ additional lists the dinucleotide relative abundance odds ratios for the uploaded dataset. Anomalies in the odds ratios can be used to identify discrepancies in metagenomes such as human DNA contamination (depression of the CG dinucleotide frequency).
Assembly quality measures
The Nxx contig size is a weighted median that is defined as the length of the smallest contig C in the sorted list of all contigs where the cumulative length from the largest contig to contig C is at least xx% of the total length (sum of contig lengths). Replace xx by the preferred value such as 90 to get the N90 contig size. The higher the Nxx value, the higher the rate of longer contigs and the better the dataset. If the dataset does not contain contigs or scaffolds, this information can be ignored.
References
1. Huse S, Huber J, Morrison H, Sogin M, Welch D: Accuracy and quality of massively parallel DNA pyrosequencing. Genome Biology 2007, 8:R143.
2. Li H, Durbin R: Fast and accurate short read alignment with Burrows-Wheeler transform. Bioinformatics 2009, 25:1754-1760.
3. Li H, Homer N: A survey of sequence alignment algorithms for next-generation sequencing. Brief Bioinform 2010.
4. Schmieder R, Lim YW, Rohwer F, Edwards R: TagCleaner: Identification and removal of tag sequences from genomic and metagenomic datasets. BMC Bioinformatics 2010, 11:341.
5. Gomez-Alvarez V, Teal TK, Schmidt TM: Systematic artifacts in metagenomes from complex microbial communities. ISME J 2009, 3:1314-1317.
6. Morgulis A, Gertz EM, Schaffer AA, Agarwala R: A fast and symmetric DUST implementation to mask low-complexity DNA sequences. J. Comput. Biol 2006, 13:1028-1040.
7. Willner D, Thurber RV, Rohwer F: Metagenomic signatures of 86 microbial and viral metagenomes. Environ. Microbiol 2009.
Data preprocessing
TOP OF PAGENot only sequencing, but also data analysis costs money. Analyzing poor data wastes CPU time and interpreting the results from poor data wastes people time. The quality control step often shows that the data needs to be preprocessed before any downstream data analysis. The necessary data preprocessing steps highly depend on the type of library being sequenced (whole genome, transcriptome, 16S, metagenome, ...) and on the type of sequencing technology used to generate the data. The following guide should ensure that the data used for downstream analysis is not compromised of low-quality sequences, sequence artifacts, or sequence contamination that might lead to erroneous conclusions. However, there is no "one-size-fits-all" solution and each user must make informed decisions as to the appropriate parameters used for preprocessing.
Manage options
The DeconSeq web version allows users to manage the filter, trim and reformat options in different ways. There are features to save or reset the options currently set, to load previously saved options or to select one of the option pre-sets. Loaded options or selected pre-sets will only be applied after clicking on the "Set new options" button at the bottom. This allows users to review the options before actually setting them.
The feature to save options allows users to process different datasets with the same parameters and to record preprocessing parameters. For parameters that are likely to be used repeatedly in the future, users can request to add those parameters to the list of pre-set options.
Filter options
Length related
Sequences in the SFF files can be as short as 40 bp (shorter sequences are filtered during signal processing). For multiplexed samples, the MID trimmed sequences can be as short at 28 bp (assuming a 12 bp MID tag). Such short sequences can cause problems during, for example, database searches to find similar sequences. Short sequences are more likely to match at a random position by chance than longer sequences and may therefore result in false positive functional or taxonomical assignments. Furthermore, short sequences are likely to be quality trimmed during the signal-processing step and of lower quality with possible sequencing errors.
In some cases, sequences can be much longer than several standard deviations above the mean length (e.g. 1,500+ bp for a 500 bp mean length with a 100 bp standard deviation). Those sequences should be used with caution as they likely contain long stretches of homopolymer runs as in the following example. Homopolymers are a known issue of pyrosequencing technologies such as 454/Roche [1].
A rule of thumb for sequence length thresholds of longer-read datasets is to filter sequences shorter than 60 bp (20 amino acids) and longer than twice the mean length.
Quality score related
In addition to the decrease in quality across the read, regions with homopolymer stretches will tend to have lower quality scores. Huse et al. [1] found that sequences with an average score below 25 had more errors than those with higher averages.
Low quality sequences can cause problems during downstream analysis. Most assemblers or aligners do not take into account quality scores when processing the data. The errors in the reads can complicate the assembly process and might cause misassemblies or make an assembly impossible.
Most published thresholds for the sequence mean quality score range from 15 to 25.
GC content related
The GC content distribution of most samples should follow a normal distribution. In some cases, a bi-modal distribution can be observed, especially for metagenomic datasets. This filter is rarely used, but proved useful to separate sequences in a bi-modal distribution.
Ambiguity code related
Sequences can contain the ambiguous base N for positions that could not be identified as a particular base. A high number of Ns can be a sign for a low quality sequence or even dataset. If no quality scores are available, the sequence quality can be inferred from the percent of Ns found in a sequence or dataset. Huse et al. [1] found that the presence of any ambiguous base calls was a sign for overall poor sequence quality.
Ambiguous bases can cause problems during downstream analysis. Assemblers such as Velvet and aligners such as SHAHA2 or BWA use a 2-bit encoding system to represent nucleotides, as it offers a space efficient way to store sequences. For example, the nucleotides A, C, G and T might be 2-bit encoded as 00, 01, 10 and 11. The 2-bit encoding, however, only allows to store the four nucleotides and any additional ambiguous base cannot be represented. The different programs deal with the problem in different ways. Some programs replace ambiguous bases with a random base (e.g. BWA [2]) and others with a fixed base (e.g. SHAHA2 and Velvet replace Ns with As [3]). This can result in misassemblies or false mapping of sequences to a reference sequence and therefore, sequences with a high number of Ns should be removed before downstream analysis.
Filtering out all reads containing Ns is only suggested if the loss can be afforded (e.g. high coverage datasets or low number of sequences with ambiguous bases). Filtering reads containing more than 1% of ambiguous bases is advised.
Data content related
To select a subset of all sequence in a dataset, the number of wanted sequences can be specified. The first X sequences passing all other specified filters can be selected this way.
The sequence duplicates can be defined using different methods. Exact duplicates are identical sequence copies, whereas 5' or 3' duplicates are sequences that are identical with the 5' or 3' end of a longer sequence. Considering the double-stranded nature of DNA, duplicates could also be considered sequences that are identical with the reverse complement of another sequence.
Depending on the dataset and downstream analysis, it should be considered to filter sequence duplicates. The main purpose of removing duplicates is to mitigate the effects of PCR amplification bias introduced during library construction. In addition, removing duplicates can result in computational benefits by reducing the number of sequences that need to be processed and by lowering the memory requirements. Sequence duplicates can also impact abundance or expression measures and can result in false variant (SNP) calling.
PRINSEQ filters duplicates without allowing mismatches, as artificial duplicates tend to have the same errors and error-models are computationally more expensive. Programs such as cdhit-454 [4] use clustering techniques to identify near identical duplicates. However, those methods tend to miss duplicates identified by PRINSEQ due to the used clustering methods. For best results, duplicates should initially be filtered using PRINSEQ and then optionally using clustering methods.
For metagenomic datasets, the exact and 5' duplicates should be removed. The 3' and reverse complement duplicates can be removed as they do not provide additional information in database searches, but might be useful for variant discovery or assembly.
Sequence complexity related
Low-complexity sequences are defined as having commonly found stretches of nucleotides with limited information content (e.g. the dinucleotide repeat CACACACACA). Such sequences can produce a large number of high-scoring but biologically insignificant results in database searches. PRINSEQ calculates the sequence complexity using the DUST and Entropy approaches as they present
two commonly used examples.
The DUST approach is adapted from the algorithm used to mask low-complexity regions during BLAST search preprocessing [5]. The scores are computed based on how often different trinucleotides occur and are scaled from 0 to 100. Higher scores imply lower complexity. A sequence of homopolymer repeats (e.g. TTTTTTTTT) has a score of 100, of dinucleotide repeats (e.g. TATATATATA) has a score around 49, and of trinucleotide repeats (e.g. TAGTAGTAGTAG) has a score around 32.
The Entropy approach evaluates the entropy of trinucleotides in a sequence. The entropy values are scaled from 0 to 100 and lower entropy values imply lower complexity. A sequence of homopolymer repeats (e.g. TTTTTTTTT) has an entropy value of 0, of dinucleotide repeats (e.g. TATATATATA) has a value around 16, and of trinucleotide repeats (e.g. TAGTAGTAGTAG) has a value around 26.
Sequences with a DUST score above 7 or an entropy value below 70 can be considered low-complexity. An entropy value of 50 or 60 would be a more conservative choice.
Custom filter parameters
The custom filter allows the specification of user defined filter using a two value system. Each new filter should be defined on a separate line and values should be separated by space. The first value defines the filter pattern (any combination of the letters "ACGTN"). The second value defines the number of repeats or percentage of occurrence of the filter pattern. The percentage values are defined by a number followed by the %-sign (without space). If no %-sign is given, it is assumed that the value specifies the number of repeats of the filter pattern.
Examples:
AAT 8 filters out sequences containing AATAATAATAATAATAATAATAAT anywhere in the sequence
T 70% filters out sequences with more than 70% T's in the sequence
A 15 filters out sequences containing AAAAAAAAAAAAAAA anywhere in the sequence
Trim options
Trim by length/position
Sequences can be trimmed to a specific length or a fixed number of nucleotides can be trimmed from either end.
Trim tails
Poly-A/T tails can be trimmed from either end specifying a minimum tail length. All repeats of As or Ts with at least this length will be trimmed from the sequence ends. A small number of tails can occur even after trimming poly-A/T tails. For example, a sequence that ends with AAAAATTTTT and that has been trimmed for the poly-T will still contain the poly-A.
Trimming poly-A/T tails can reduce the number of false positives during database searches, as long tails tend to align well to sequences with low complexity or sequences with poly-A tails in the database.
Trim ends by quality scores
As for Sanger sequencing, next-generation sequencers produce data with linearly degrading quality across the read. The quality scores for 454/Roche sequencers are Phred-based since version 1.1.03, ranging from 0 to 40. Phred values are log-scaled, where a quality score of 10 represents a 1 in 10 chance of an incorrect base call and a quality score of 20 represents a 1 in 100
chance of an incorrect base call.
Sequences can be trimmed from either end using different rules applied to a sliding window. To stop at the first base that fails the rule defined, use a window size of 1. A bigger window size can trim sequences that might contain a high quality score in between low quality scores without stopping at the high quality score. To move the sliding window over all quality scores without missing any, the step size should be less or equal to the window size.
Note:
The quality trimming during the signal processing step (see Raw data processing PDF file) may not be sufficient. Trimmed sequences can end with low quality bases or even with ambiguous base N (approx. 1%). Reads with RLMIDs (Rapid library multiplex identifiers) may be trimmed in high quality regions as the default behavior will cause the reads to be trimmed at the first position the MID sequence matches, even if it is not the MID but a natural occurring match inside the read.
The parameters should be set to trim positions with a quality score below 20.
Reformat options
Reformat sequences
The sequence characters case can be changed between lower and upper case. This can be useful to, for example, remove soft-masking from sequences.
Sequences can be converted between RNA and DNA. This can be useful to, for example, convert RNA sequences into DNA before generating a BLAST nucleotide database.
Reformat header lines
The header line of a sequence in FASTA or FASTQ format contains the ">" symbol followed by the sequence identifier (sequence name) and an optional description separated by space. In many cases, the description in the sequence header is not used for any downstream analysis. Removing the description in the sequence header can significantly reduce the size of the FASTA or FASTQ file. The sequence header can contain information about the sequence that can be incorrect after data preprocessing (e.g. trimming) and therefore should be corrected or removed.
The sequence identifiers can be renamed to contain new information or to ensure that all sequences have a unique identifier, which is required by most programs used for downstream analysis. Sequence identifiers should not contain spaces, >, or quotes (which will be automatically removed by PRINSEQ). A counter is added to each identifier to assure its uniqueness. For example, "mySeq_10" will generate the IDs (in FASTA format):
>mySeq_101
ACGTACGTACGT
>mySeq_102
ACGTACGTACGT
>mySeq_103
...
References
1. Huse S, Huber J, Morrison H, Sogin M, Welch D: Accuracy and quality of massively parallel DNA pyrosequencing. Genome Biology 2007, 8:R143.
2. Li H, Durbin R: Fast and accurate short read alignment with Burrows-Wheeler transform. Bioinformatics 2009, 25:1754-1760.
3. Li H, Homer N: A survey of sequence alignment algorithms for next-generation sequencing. Brief Bioinform 2010.
4. Niu B, Fu L, Sun S, Li W: Artificial and natural duplicates in pyrosequencing reads of metagenomic data. BMC Bioinformatics 2010, 11:187.
5. Morgulis A, Gertz EM, Schaffer AA, Agarwala R: A fast and symmetric DUST implementation to mask low-complexity DNA sequences. J. Comput. Biol 2006, 13:1028-1040.
Standalone lite version
TOP OF PAGEThe standalone lite version does not provide any graphical outputs and is designed for preprocessing purposes only. This version is called "lite" as it does not require any
non-core Perl modules for processing (no installation of additional Perl modules or third party programs is required). The readme file contains information on the usage of the standalone lite version.
The lite version can generate graph data files that can be used to generate the graphical outputs using the standalone graphs version or an online form (see below).
Necessary resources
Hardware
- Computer with a Linux/Unix or Mac OS X operating system
Software
- PRINSEQ lite (available at http://prinseq.sourceforge.net)
Files
- FASTA file with sequence data
- QUAL file with quality scores (if available)
- FASTQ file (as alternative format)
Available options
|
Option/flag |
Description |
Default |
Range |
-help or -h |
Print the help message; ignore other arguments |
||
-man |
Print the full documentation; ignore other arguments |
||
-version |
Print program version; ignore other arguments |
||
-verbose |
Prints status and info messages during processing |
||
| Input options | |||
-fastq |
Input file in FASTQ format that contains the sequence and quality data. Use stdin instead of a file name to read from STDIN (-fasta stdin). This can be useful to process compressed files using Unix pipes. |
|
FILE, stdin |
-fasta |
Input file in FASTA format that contains the sequence data. Use stdin instead of a file name to read from STDIN (-fastq stdin). This can be useful to process compressed files using Unix pipes. |
|
FILE, stdin |
-qual |
Input file in QUAL format that contains the quality data |
|
FILE |
-fastq2 |
For paired-end data only. Input file in FASTQ format that contains the sequence and quality data. The sequence identifiers for two matching paired-end sequences in separate files can be marked by /1 and /2, or _L and _R, or _left and _right, or must have the exact same identifier in both input files. The input sequences must be sorted by their sequence identifiers. Singletons are allowed in the input files. |
|
FILE |
-fasta2 |
or paired-end data only. Input file in FASTA format that contains the sequence data. The sequence identifiers for two matching paired-end sequences in separate files can be marked by /1 and /2, or _L and _R, or _left and _right, or must have the exact same identifier in both input files. The input sequences must be sorted by their sequence identifiers. Singletons are allowed in the input files. |
|
FILE |
-params |
Input file in text format that contains PRINSEQ parameters. Each parameter should be specified on a new line and arguments should be separated by spaces or tabs. Commends can be specified on lines starting with the # sign. Can be combined with command line parameters. Parameters specified on the command line will overwrite the arguments in the file (if any). |
|
FILE |
-si13 |
This option was replaced by option -phred64. |
|
|
-phred64 |
Quality data in FASTQ file is in Phred+64 format (hhttp://en.wikipedia.org/wiki/FASTQ_format#Encoding). Not required for Illumina 1.8+, Sanger, Roche/454, Ion Torrent, PacBio data. |
|
|
-aa |
Input is amino acid (protein) sequences instead of nucleic acid (DNA or RNA) sequences. Allowed amino acid characters: ABCDEFGHIKLMNOPQRSTUVWYZXabcdefghiklmmopqrstuvwyzx*- and allowed nucleic acid characters: ACGTURYKMSWBDHVNXacgturykmswbdhvnx- |
|
|
| Output options | |||
-out_format |
Output format |
same as input |
[1,2,3,4,5] |
-out_good |
By default, the output files are created in the same directory as the input file containing the sequence data with an additional "_prinseq_good_XXXX" in their name (where XXXX is replaced by random characters to prevent overwriting previous files). To change the output filename and location, specify the filename using this option. The file extension will be added automatically (either .fasta, .qual, or .fastq). For paired-end data, filenames contain additionally "_1", "_1_singletons", "_2", and "_2_singletons" before the file extension. Use "-out_good null" to prevent the program from generating the output file(s) for data passing all filters. Use "-out_good stdout" to write data passing all filters to STDOUT (only for FASTA or FASTQ output files). |
STRING, null, stdout |
|
-out_bad |
By default, the output files are created in the same directory as the input file containing the sequence data with an additional "_prinseq_bad_XXXX" in their name (where XXXX is replaced by random characters to prevent overwriting previous files). To change the output filename and location, specify the filename using this option. The file extension will be added automatically (either .fasta, .qual, or .fastq). For paired-end data, filenames contain additionally "_1" and "_2" before the file extension. Use "-out_bad null" to prevent the program from generating the output file(s) for data not passing any filter. Use "-out_bad stdout" to write data not passing any filter to STDOUT (only for FASTA or FASTQ output files). |
STRING, null, stdout |
|
-log |
Log file to keep track of parameters, errors, etc. The log file name is optional. If no file name is given, the log file name will be "inputname.log". If the log file already exists, new content will be added to the file. |
input name.log |
STRING |
-graph_data |
File that contains the necessary information to generate the graphs similar to the ones in the web version. The file name is optional. If no file name is given, the log file name will be "inputname.gd". If the file already exists, new content will overwrite the file. Use "-out_good null -out_bad null" to prevent generating any additional outputs. (See below for more options related to the graph data.) |
input name.gd |
STRING |
Use this option to select what statistics should be calculated and included in the graph_data file. This is useful if you e.g. do not need sequence complexity information, which requires a lot of computation. Requires to have graph_data specified. Default is all selected. |
all |
STRING |
|
-qual_noscale |
Use this option if all your sequences are shorter than 100bp and as they do not require to scale quality data to 100 data points in the graph. By default, quality scores of sequences shorter than 100bp or longer than 100bp are fit to 100 data points. (To retrieve this information and calculate the graph data would otherwise require to parse the data two times or store all the quality data in memory.) |
|
|
-no_qual_header |
In order to reduce the file size, this option will generate an empty header line for the quality data in FASTQ files. Instead of +header, only the + sign will be output. The header of the sequence data will be left unchanged. This option applies to FASTQ output files only. |
|
|
-exact_only |
Use this option to check for exact (forward and reverse) duplicates only when generating the graph data. This allows to keep the memory requirements low for large input files and is faster. This option will automatically be applied when using -derep options 1 and/or 4. |
|
|
| Filter options | |||
-min_len |
Filter sequence shorter than min_len |
|
INT |
-max_len |
Filter sequence longer than max_len |
|
INT |
-range_len |
Filter sequence by length range. Multiple range values should be separated by comma without spaces. |
|
STRING |
-min_gc |
Filter sequence with GC content below min_gc |
|
INT [0..100] |
-max_gc |
Filter sequence with GC content above max_gc |
|
INT [0..100] |
-range_gc |
Filter sequence by GC content range. Multiple range values should be separated by comma without spaces. |
|
STRING |
-min_qual_score |
Filter sequence with at least one quality score below min_qual_score |
|
INT |
-max_qual_score |
Filter sequence with at least one quality score above max_qual_score |
|
INT |
-min_qual_mean |
Filter sequence with quality score mean below min_qual_mean |
|
INT |
-max_qual_mean |
Filter sequence with quality score mean above max_qual_mean |
|
INT |
-ns_max_p |
Filter sequence with more than ns_max_p percentage of Ns |
|
INT [0..100] |
-ns_max_n |
Filter sequence with more than ns_max_n Ns |
|
INT |
-noniupac |
Filter sequence with characters other than A, C, G, T or N |
|
|
-seq_num |
Only keep the first seq_num number of sequences (that pass all other filters) |
|
INT |
-derep |
Type of duplicates to filter. Allowed values are 1, 2, 3, 4 and 5. Use integers for multiple selections (e.g. 124 to use type 1, 2 and 4). The order does not matter. Option 2 and 3 will set 1 and option 5 will set 4 as these are subsets of the other option. |
|
INT |
-derep_min |
This option specifies the number of allowed duplicates. If you want to remove sequence duplicates that occur more than x times, then you would specify x+1 as the -derep_min values. For examples, to remove sequences that occur more than 5 times, you would specify -derep_min 6. This option can only be used in combination with -derep 1 and/or 4 (forward and/or reverse exact duplicates). |
2 |
INT [2..] |
-lc_method |
Method to filter low complexity sequences |
|
[dust, entropy] |
-lc_threshold |
The threshold value used to filter sequences by sequence complexity. The dust method uses this as maximum allowed score and the entropy method as minimum allowed value. |
|
INT [0..100] |
-custom_params |
Can be used to specify additional filters. The current set of possible rules is limited and has to follow the specifications below. The custom parameters have to be specified within quotes (either ' or "). |
|
STRING |
| Trim options | |||
-trim_to_len |
Trim all sequence from the 3'-end to result in sequence with this length |
|
INT |
-trim_left |
Trim sequence at the 5'-end by trim_left positions |
|
INT |
-trim_right |
Trim sequence at the 3'-end by trim_right positions |
|
INT |
-trim_left_p |
Trim sequence at the 5'-end by trim_left_p percentage of read length. The trim length is rounded towards the lower integer (e.g. 143.6 is rounded to 143 positions). Use an integer between 1 and 100 for the percentage value. |
|
INT |
-trim_right_p |
Trim sequence at the 3'-end by trim_right_p percentage of read length. The trim length is rounded towards the lower integer (e.g. 143.6 is rounded to 143 positions). Use an integer between 1 and 100 for the percentage value. |
|
INT |
-trim_tail_left |
Trim poly-A/T tail with a minimum length of trim_tail_left at the 5'-end |
|
INT |
-trim_tail_right |
Trim poly-A/T tail with a minimum length of trim_tail_right at the 3'-end |
|
INT |
-trim_ns_left |
Trim poly-N tail with a minimum length of trim_ns_left at the 5'-end |
|
INT |
-trim_ns_right |
Trim poly-N tail with a minimum length of trim_ns_right at the 3'-end |
|
INT |
-trim_qual_left |
Trim sequence by quality score from the 5'-end with this threshold score |
|
INT |
-trim_qual_right |
Trim sequence by quality score from the 3'-end with this threshold score |
|
INT |
-trim_qual_type |
Type of quality score calculation to use |
min |
[min,mean,max,sum] |
-trim_qual_rule |
Rule to use to compare quality score to calculated value. Allowed options are lt (less than), gt (greater than) and et (equal to) |
lt |
[lt,gt,et] |
-trim_qual_window |
The sliding window size used to calculate quality score by type. To stop at the first base that fails the rule defined, use a window size of 1. |
1 |
INT |
-trim_qual_step |
Step size used to move the sliding window. To move the window over all quality scores without missing any, the step size should be less or equal to the window size. |
1 |
INT |
| Reformat options | |||
-seq_case |
Changes sequence character case to upper or lower case |
|
[upper,lower] |
-dna_rna |
Convert sequence between DNA and RNA. Allowed options are "dna" (convert from RNA to DNA) and "rna" (convert from DNA to RNA). |
|
[dna,rna] |
-line_width |
Sequence characters per line. Use 0 if you want each sequence in a single line. Use 80 for line breaks every 80 characters. Note that this option only applies to FASTA output files, since FASTQ files store sequences without additional line breaks. |
60 |
INT |
-rm_header |
Remove the sequence header. This includes everything after the sequence identifier (which is kept unchanged) |
|
|
-seq_id |
Rename the sequence identifier. A counter is added to each identifier to assure its uniqueness |
|
STRING |
| Summary statistic options * | |||
-stats_info |
Outputs basic information such as number of reads (reads) and total bases (bases). |
|
|
-stats_len |
Outputs minimum (min), maximum (max), range (range), mean (mean), standard deviation (stddev), mode (mode) and mode value (modeval), and median (median) for read length. |
|
|
-stats_dinuc |
Outputs the dinucleotide odds ratio for AA/TT (aatt), AC/GT (acgt), AG/CT (agct), AT (at), CA/TG (catg), CC/GG (ccgg), CG (cg), GA/TC (gatc), GC (gc) and TA (ta). |
|
|
-stats_tag |
Outputs the probability of a tag sequence at the 5'-end (prob5) and 3'-end (prob3) in percentage (0..100). Provides the number of predefined MIDs (midnum) and the MID sequences (midseq, separated by comma, only provided if midnum > 0) that occur in more than 34/100 (approx. 3%) of the reads. |
|
|
-stats_dupl |
Outputs the number of exact duplicates (exact), 5' duplicates (5), 3' duplicates (3), exact duplicates with reverse complements (exactrevcom) and 5'/3' duplicates with reverse complements (revcomp), and total number of duplicates (total). The maximum number of duplicates is given under the value name with an additional "maxd" (e.g. exactmaxd or 5maxd). |
|
|
-stats_ns |
Outputs the number of reads with ambiguous base N (seqswithn), the maximum number of Ns per read (maxn) and the maximum percentage of Ns per read (maxp). The maxn and maxp value are not necessary from the same sequence. |
|
|
-stats_assembly |
Outputs the N50, N90, etc contig sizes. The Nxx contig size is a weighted median that is defined as the length of the smallest contig C in the sorted list of all contigs where the cumulative length from the largest contig to contig C is at least xx% of the total length (sum of contig lengths). |
|
|
-stats_all |
Outputs all available summary statistics. |
|
|
* The summary statistic values are written to STDOUT in the form: "parameter_name statistic_name value" (without the quotes). For example, "stats_info reads 10000" or "stats_len max 500". Only one statistic is written per line and values are separated by tabs.
Standalone graphs version
TOP OF PAGEThe standalone graphs version can be used to generate graphs as PNG files or a HTML report file containing the graphs and tables. The readme file contains information on the usage of the standalone graphs version.
Necessary resources
Hardware
- Computer with a Linux/Unix or Mac OS X operating system
Software
- PRINSEQ graphs (available at http://prinseq.sourceforge.net)
Files
- Graph data file
Available options
|
Option/flag |
Description |
Default |
Range |
-help or -h |
Print the help message; ignore other arguments |
||
-man |
Print the full documentation; ignore other arguments |
||
-version |
Print program version; ignore other arguments |
||
-verbose |
Prints status and info messages during processing |
||
| Input options | |||
-i |
Input file containing the graph data generated by the lite version. |
|
FILE, stdin |
| Output options | |||
-o |
By default, the output files are created in the same directory as the input file with an additional "_prinseq_graphs_XXXX" in their name (where XXXX is replaced by random characters to prevent overwriting previous files). To change the output filename and location, specify the filename using this option. The file extension will be added automatically. |
input name.gd |
STRING |
-png_all |
Use this option to generate PNG files with the graphs. |
|
|
-html_all |
Use this option to generate a HTML file with the graphs and tables. |
|
|
-log |
Log file to keep track of parameters, errors, etc. The log file name is optional. If no file name is given, the log file name will be "inputname.log". If the log file already exists, new content will be added to the file. |
input name.log |
STRING |
Examples
The following examples apply to version 0.16 and higher.
Graph data (-graph_data)
To generate the graphs from the web version or the HTML report, you can use the -graph_data option:
$ perl prinseq-lite.pl -verbose -fastq test.fq -graph_data test.gd -out_good null -out_bad null
Estimate size of input data for status report (this might take a while for large files)
	done
Parse and process input data
	status: 34 %
The verbose mode shows the progress and the "-out_good null -out_bad null" prevents PRINSEQ from generating any other output files than the specified test.gd file containing the graphs data.
Generating graph PNG files (-png_all)
To generate the graph as PNG files, you can use the prinseq-graphs -png_all option:
$ perl prinseq-graphs.pl -i test.gd -png_all -o testThis should create the following PNG files:
$ ls *.png
test_cd.png	test_dl.png	test_ld.png	test_pm.png	test_td5.png
test_ce.png	test_dm.png	test_ns.png	test_pv.png
test_df.png	test_gc.png	test_or.png	test_td3.png
Generating HTML reports (-html_all)
To generate the HTML report containing all the tables and figures from the web version, you can use the prinseq-graphs -html_all option:
$ perl prinseq-graphs.pl -i test.gd -html_all -o testThis should create the following HTML file:
$ ls *.html
test.html
Note that the prinseq-graphs.pl file requires the graphics modules to be installed. If you are unable to install the graphics modules on your system, you can also use an online form to generate the HTML report file from the graph data file:
http://edwards.sdsu.edu/prinseq
Graph data selection (-graph_stats)
To generate the graphs from the web version or the HTML report for a selected number of statistics, you can use the -graph_stats option in combination with the -graph_data option:
$ perl prinseq-lite.pl -verbose -fastq test.fq -graph_data test.gd -out_good null -out_bad null -graph_stats ld,gc,qdThis feature is available in version 0.19 and higher and currently allows to select the options described here.
Remove sequences with N from FASTQ files (-ns_max_n and -ns_max_p)
To remove sequences with a certain number or percentage of ambiguous base N from a FASTQ file, you can use the PRINSEQ options -ns_max_n or -ns_max_p as follows:
$ perl prinseq-lite.pl -verbose -fastq test.fq -ns_max_n 0 -out_good test_no_ns -out_bad test_with_nsThis will separate the input FASTQ files into two files (test_no_ns.fastq containing sequences without N and test_with_ns.fastq containing all sequences with at least one N). You can replace the value for -ns_max_n with, for example, 2 to remove sequences with more than 2 Ns. Alternatively, you can use "-ns_max_p 1" to remove sequences with more than 1% of Ns.
Process paired-end FASTQ files with PRINSEQ (-fastq and -fastq2)
To process paired-end data with PRINSEQ, you can specify the two input files using -fastq and -fastq2 (or -fasta and fasta2 for FASTA files) as follows:
$ perl prinseq-lite.pl -verbose -fastq test_1.fq -fastq2 test_2.fq -ns_max_n 0 -out_good test_no_ns -out_bad test_with_nsSingletons will automatically be filtered and stored in separate files (here test_no_ns_1_singletons.fastq and test_no_ns_2_singletons.fastq) in addition to the files test_no_ns_1.fastq, test_no_ns_2.fastq, test_with_ns_1.fastq, and test_with_ns_2.fastq.